I’ve asked people more than once if they know the Dunning-Kruger effect and they’ve mostly said yes. And I’ve been asked more than once myself, and I too have said yes.
However, I’ve never read the original 1999 study. And I bet most other people haven’t either. Did you even have a clue that it was titled ‘Unskilled and Unaware of It: How Difficulties in Recognizing One’s Own Incompetence Lead to Inflated Self-Assessments’? I want to say that I did, have a clue at least, but the more I’ve read about it over the years the more I’ve doubted everything that I ever thought I knew.
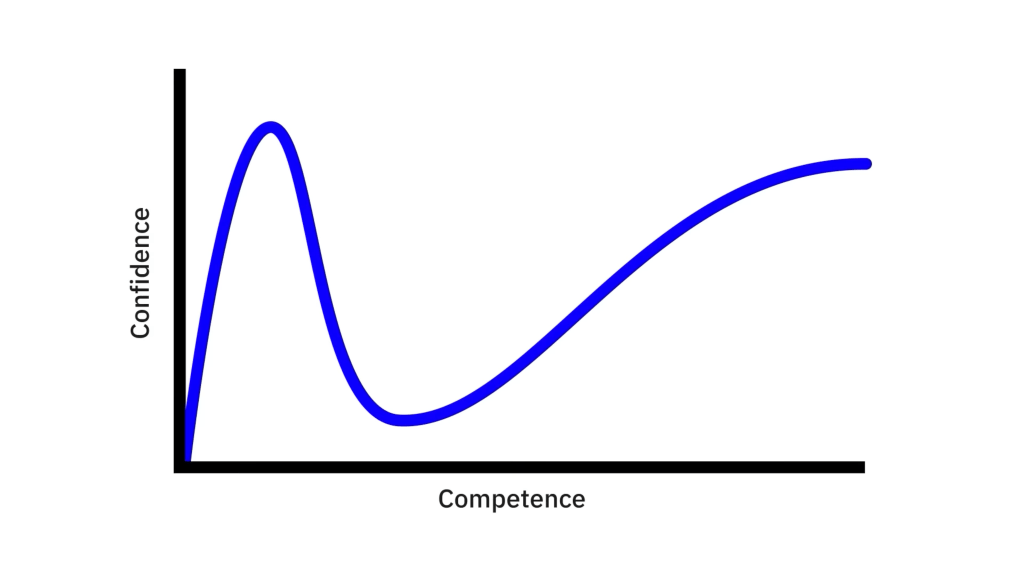
In fact, this graph, that you’ll find on every Medium post claiming authority on the subject, and down every image search result page for the term, isn’t from the Dunning-Kruger study. This isn’t ‘the Dunning-Kruger effect’…
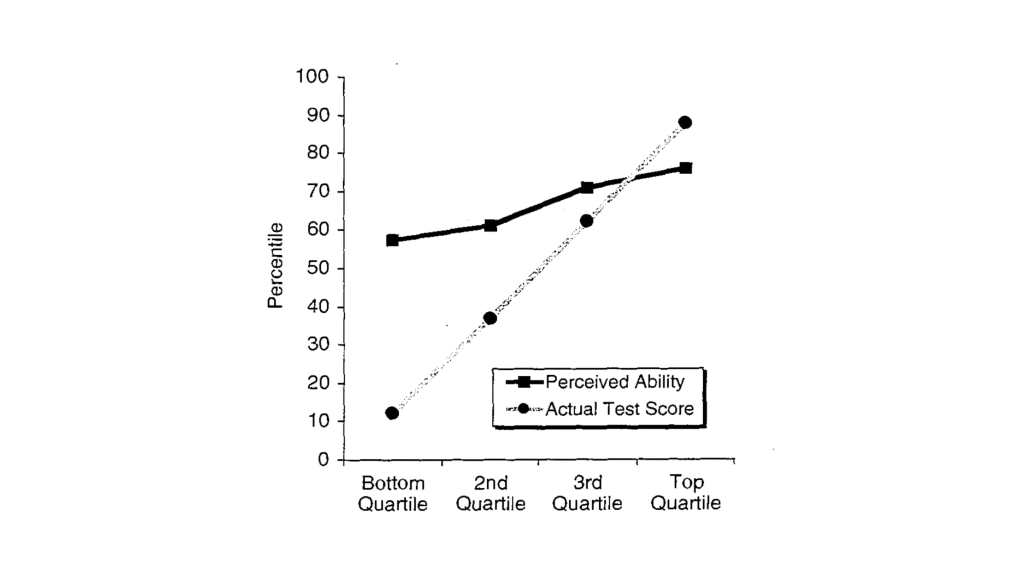
This is from the actual study, and more representative of all its other graphs…
I’ve read about this false graph issue before, but never really dug into it, but doing so recently I came across this helpful video essay: The Irony of the Dunning-Kruger Effect (from where I’ve taken the graph images above). This is hardly deep research, but it did at least prompt me to check out the original study to verify!
The conundrum of where the incorrect graph comes from though seems to remain unsolved, and it wasn’t from the Wikipedia page. That’s never featured the wrong graph, and actually only had a correct graph added in 2022. Perhaps it being so late to the page is why the wrong one has persisted so long?
One theory I’ve seen for the incorrect graph is that it’s an easy way to understand the ‘general’ concept of the effect, however, in my reading there’s no suggestion of any valley of despair, which feels more like it’s from the Gartner hype cycle… which I’m painfully aware that I don’t really know enough about either.
I wonder if there’s a term for the self doubt that’s felt after reading about the Dunning-Kruger effect? Maybe that’s the valley of despair, because it sure does feel real. And to that end, maybe that’s why the ‘false’ graph is so popular? Maybe it is actually correct and representative of both ideas. A graph of the Dunning-Kruger effect, and our collective lived experience, of realising when we’ve been overconfident and in fact have much more to learn.
This is now also reminding me of the OK Plateau. Not to be confused with OK Go.
OK, I’ve plateaued, down in the valley, and unsure if I’m in a top quartile of understanding anything. What a Pandoras Box.
